This page created 27 Jul 2001; reformatted 20 Jan 2002
Applies to Version 8 & 9
Traditionally ancestor charts are formatted in tree fashion, with the focus person at the bottom, and all the ancestors arranged above like branches of a tree. However, because of the horizontal orientation of the individual boxes, it turns out that you can fit many more ancestors on a chart if you arrange the chart from left to right, instead of from bottom to top. See the photo below for an example. I recommend this arrangement if want to fit a large number of ancestors on a chart.
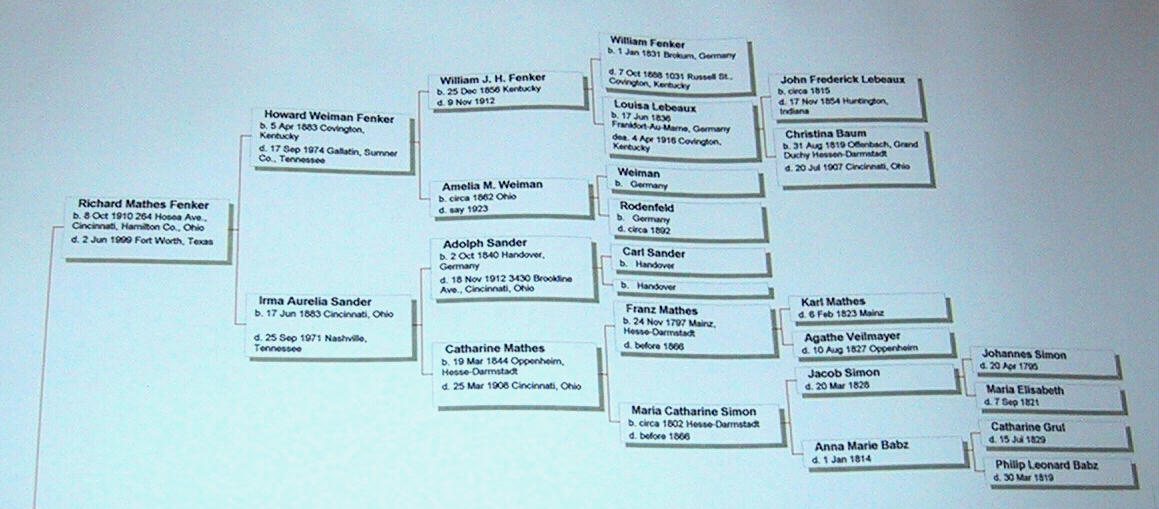
I find I can fit around 14 generations across a three-foot wide chart with reasonable sized type for viewing from about two or three feet away. The height of such a chart depends on how complete your family information is. The suggested settings below produce a chart like that shown in the photos, and may give a starting point for creating your own chart.
Here are the setting I use for my wall charts - the references are to the tabs on the Options Screen, reached from Report Definition Screen:
Chart Style tab:
- Orientation – Left to Right
- Chart Size – 15 generations
- Gap between boxes, same generation – 5
- Gap between boxes, between generations – 20
Boxes tab:
- Box size, Width – 165 pixels
- Box size, Minimum height – 10 pixels
- Box fill, Color – white
- Box border,Color – blue
- Box border, Width – 1 pixel
- Frame – Grey shadow
Lines tab:
- Connector line, Width – 2 pixels
- Connector line, Color – red
Text tab:
- Title – Tahoma, 10 pt., bold, black
- Names – Arial, 9 pt., bold, black
- Data lines – Arial, 8 pt., regular, black
Background tab:
- Solid, Color – White
Data Type tab:
- Place preposition – (Blank)
I apply the following settings (Box Contents) to the Focus Person, Male Ancestors, and Female Ancestors. I use the combination date/place entries to avoid empty lines in charts when only one or the other is known. I do not include marriages because TMG creates an empty line for the marriage when there are marriage tags with no date or place information, and I find those empty lines bothersome.
- 1 – Birth* Group Abbr Date Placeprep Place
- 2 – Death* Group Abbr Date Placeprep Place
- all others – (blank)
Other tab:
- Miscellaneous – Allow Word Wrap
After generating the chart, I like to make a number of changes that cannot be done with the options settings. I do these by editing the chart in VCF. See my Chart Editing Tips for details.
| ReigelRidge Home | Terry's Tips Home | Contact Terry |
Copyright 2000- by Terry Reigel